is it real questions 2
Why Do Two Labs Report Different Purity for the Same Batch?
Because purity is a method-defined number, and two competent laboratories rarely use the same method. Small gaps are expected and usually mean nothing. Large ones mean the labs saw different material, or one method missed something.
Because a purity figure is defined by the method that produced it, and two laboratories almost never run the same method. Detection wavelength, gradient, column chemistry and the way peaks are integrated all move the number, so two competent analyses of identical material can honestly disagree. And sometimes the two laboratories were not looking at identical material at all.
What the number itself represents — one peak's share of the detected area — is explained elsewhere on this site. This page answers the next question: why that share comes out differently in different hands, and how to tell a gap that means nothing from one that means something. What a buyer should then decide is a separate matter; the aim here is to explain the disagreement, not to adjudicate it.
Is it normal for two labs to disagree?
Yes. Measurement always carries uncertainty, and part of that uncertainty only shows up when different laboratories measure the same thing. This has been studied directly for peptides rather than assumed.
A multi-laboratory study organised around oxytocin compared the reproducibility of the main ways peptides are quantified — chromatographic assay, quantitative nuclear magnetic resonance and amino acid analysis — across participating laboratories, and found that the methods differed in how closely laboratories agreed, with a chromatographic assay against a standard made from the same material showing the least spread 4. Work on establishing peptide reference standards found statistically significant differences between laboratories assaying the same lyophilised vials, and identified an outlying laboratory whose removal narrowed the result 5.
These were well-resourced laboratories working to agreed protocols on carefully controlled material. If they disagree measurably, two commercial laboratories working to their own in-house methods on vials sent separately will disagree too. The existence of a gap is not the finding. Its size and its cause are.
How can the same kind of test give different numbers?
Because "HPLC purity" names a family of methods rather than one method. The pharmacopoeial chapters on chromatography — harmonised across the European, United States and Japanese pharmacopoeias — set out requirements such as system suitability, and define how far chromatographic conditions may be adjusted without fundamentally changing a procedure 1 2. Within those limits, and entirely outside them for a laboratory writing its own method, there is a great deal of room.
- Detection wavelength. Detection close to where the peptide bond absorbs sees nearly every peptide-related species. A longer wavelength picks out aromatic residues and changes the apparent size of each peak relative to the others.
- Gradient. A shallow gradient pulls apart species that a steep one delivers together as a single peak.
- Column chemistry. Different stationary phases resolve different pairs of compounds, so the impurity hiding under the main peak on one column may sit clear of it on another.
- Run window. Anything that elutes after the run stops, or in the injection disturbance at the start, is simply not counted.
- Sample preparation. Solvent, concentration and time between dissolving and injecting can all change what reaches the column.
The effect of each choice falls hardest on the impurities that matter most in synthetic peptides. Deletion sequences, truncations and oxidised or deamidated variants are close relatives of the target, similar in size and hydrophobicity 6. Whether they separate from the main peak is exactly what the method decides. Where they separate, they count as impurity. Where they co-elute, they are counted as product, and the purity figure rises without the material changing at all.
How much does peak integration matter?
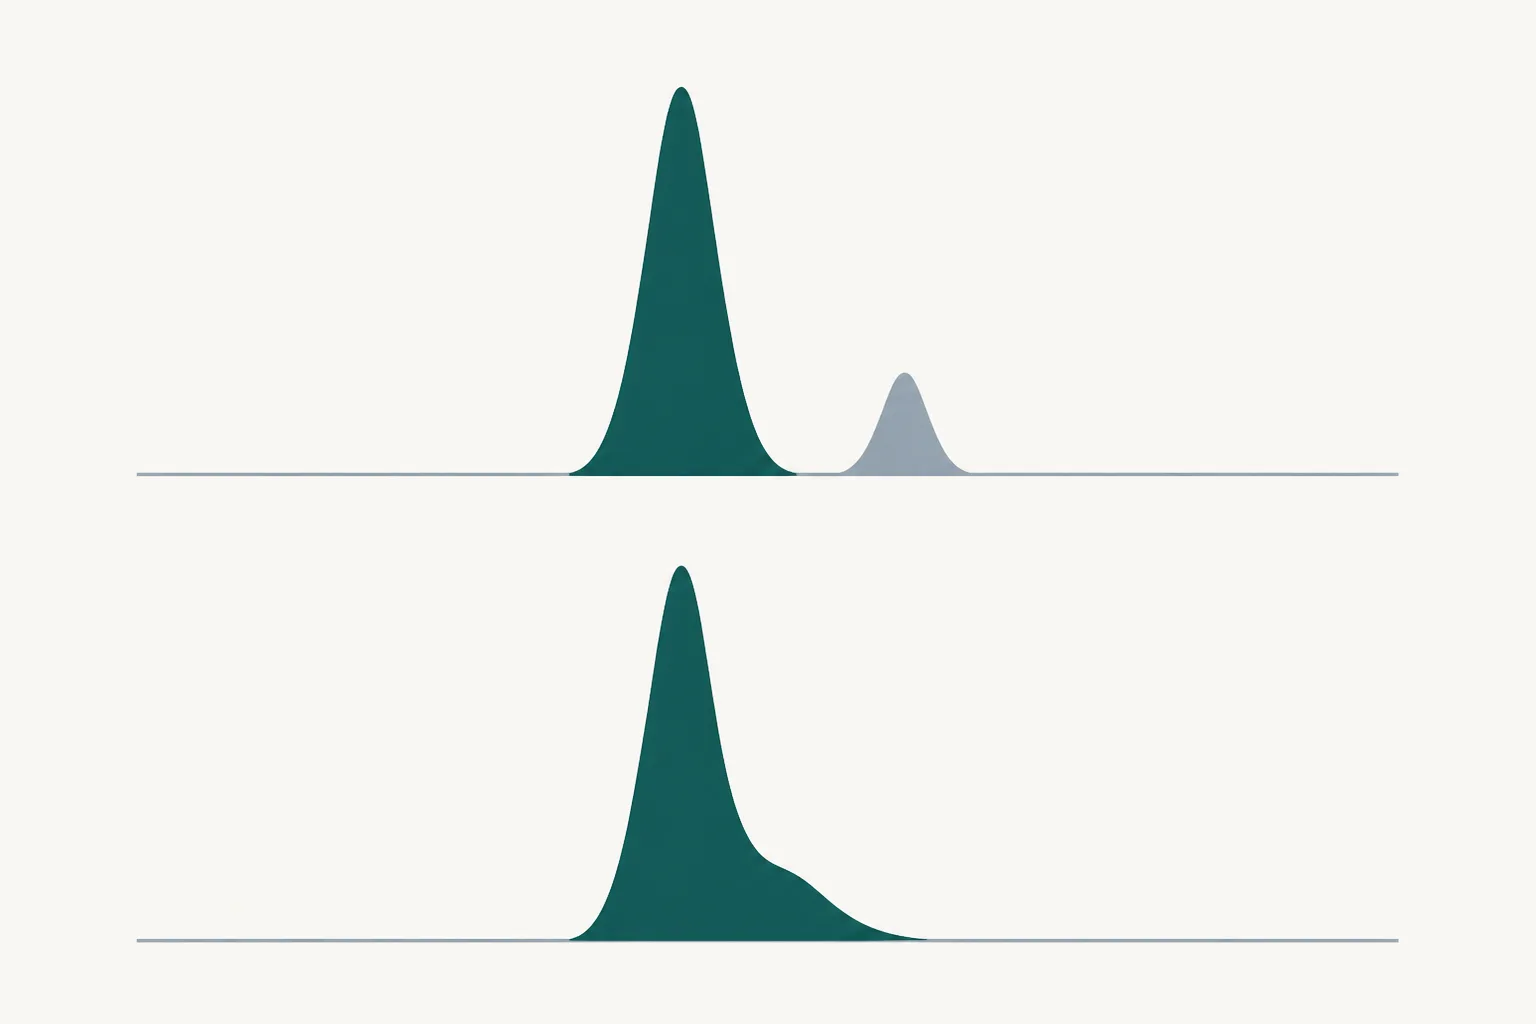
More than most readers of a certificate would guess. Once the chromatogram has been recorded, software has to decide where each peak starts and ends and where the baseline runs beneath it. For cleanly separated peaks this is trivial. For a main peak with a partly resolved shoulder, it is a choice.
A systematic study of integration errors compared the common ways of splitting partly resolved peaks — a perpendicular drop, a valley-to-valley baseline, and two forms of skimming — against reference injections. It found that the methods produced different errors, that the valley approach consistently understated both peaks, that one skimming approach significantly understated the shoulder, and that resolution below a certain level generated unacceptable errors as relative peak size changed 3. None of these is a mistake in the careless sense. They are different defensible rules, and they return different areas.
For a purity figure, the consequence is direct. The small peaks crowding the base of a large one are the impurities, and the rule used to separate them from the main peak moves them into or out of the total. This is one reason a chromatogram is worth more than the percentage printed beneath it: a reader can see whether the shoulders were there and how they were treated.
Did both labs actually test the same thing?
Often not quite, and this explains more large gaps than method does. "The same batch" usually means two vials believed to come from one production run, sent at different times, stored differently in between, and opened on different days.
Each of those differences can change the material. Lyophilised peptides degrade slowly, and oxidation of susceptible residues or deamidation of asparagine produces exactly the close relatives that appear as new peaks near the main one 6. A vial tested soon after manufacture and one tested months later after a warm journey are, chemically, not the same sample. Vial-to-vial variation within a batch is small for well-controlled material but measurable 5, and less well-controlled material has more of it.
Then there is the plainer possibility that the two vials were never from the same batch. Without a batch identifier on both vials and both reports, "the same batch" is an assumption rather than a fact, and a disagreement between two results may simply be the correct measurement of two different materials.
What does a gap of one or two percentage points mean?
Usually very little. A difference of that size between two laboratories using different methods sits comfortably within what wavelength, gradient and integration choices can produce on their own. Both results may be accurate descriptions of the same material under different conditions.
The same logic applies to specifications. A limit such as "not less than" a given purity is a threshold a batch passed, not a score it achieved, so two reports on either side of a quoted figure are not necessarily contradicting each other. A small gap is a reason to look at the methods and chromatograms if the difference matters to the work. It is not a reason to conclude that either laboratory is wrong.
What does a gap of ten percentage points mean?
That something beyond ordinary method differences needs explaining. For a well-made peptide analysed competently, reasonable changes in wavelength, gradient and integration do not normally move the figure that far. When they appear to, one of a handful of explanations is usually responsible.
| Size of gap | Likely explanations | What would tell them apart |
|---|---|---|
| A point or two | Wavelength, gradient, column or integration differences | Comparing the stated methods and chromatograms |
| Several points | One method resolving close relatives the other merged; some degradation between tests | Shoulders visible on one trace; testing dates and storage history |
| Ten points or more | Different material; significant degradation; a co-eluting impurity hidden by one method | Batch identifiers on both reports; new peaks near the main one; mass spectrometric data |
| One result high, identity unconfirmed | A clean peak that is not the claimed molecule | Mass spectrometry, since purity cannot address identity |
The last row deserves emphasis. Purity measures how uniform the material is, not whether it is the right molecule. A high figure from one laboratory and a low figure from another may mean the first saw a well-purified sample of something else. That question is answered by identity testing, not by arguing over which purity figure to believe.
Can the higher purity figure be the less accurate one?
Yes, and more often than intuition suggests. A method that fails to separate an impurity from the main peak counts that impurity as product, so poorer separation produces a higher purity figure. Given two results on the same material, the flattering one is not automatically the better measurement. It may simply be the one that saw less.
This is the reason method validation puts so much weight on specificity: showing that the procedure can distinguish the analyte from the substances likely to be present alongside it, including degradation products and process impurities 7. A method that has never been challenged with the close relatives of a peptide cannot be assumed to resolve them. Integration compounds the effect, since the baseline rules that understate small shoulder peaks push those areas back into the main peak 3.
The chromatograms usually settle it. A trace showing a sharp main peak with small, clearly separated neighbours is doing its job, whatever number it produced. A trace with a broad main peak, a sloping flank or a shoulder that has been absorbed into the total may be reporting a higher figure precisely because it could not see what the other laboratory saw. Read that way, the lower number is sometimes the more informative one.
What makes two results comparable?
Enough information to see whether the same question was asked of the same material. A result is only as interpretable as the procedure behind it, which is why guidance on validating analytical procedures asks that a method be shown to be specific for the analyte, able to separate it from likely impurities and precise across the range reported 7. Two figures from methods nobody has described cannot be compared with each other or with anything else.
- The same batch identifier on both reports, matching the vials tested.
- The method stated in each: column, gradient, detection wavelength and run time.
- The chromatogram attached, so peak shapes and shoulders can be seen.
- Testing dates, with some idea of how each vial was stored beforehand.
- Identity confirmed by mass in both, so that both laboratories are known to have measured the right molecule.
With those in hand, most disagreements explain themselves. Without them, a pair of conflicting numbers is two claims with no way to arbitrate between them — and the honest position is that the disagreement has not yet been understood, rather than that one laboratory must be lying.
The broader point is that a purity figure was never a fixed property waiting to be read off the material. It is the output of a procedure, and different procedures give different outputs. Two laboratories disagreeing is the system working as it always does. What deserves attention is not the fact of disagreement but a gap too large for the methods to explain.
References
- <621> Chromatography
- Ph. Eur. Commission adopts harmonised general chapter 2.2.46. Chromatographic separation techniques
- Integration Errors in Chromatographic Analysis, Part I: Peaks of Approximately Equal Size
- Survey of peptide quantification methods and comparison of their reproducibility: A case study using oxytocin
- Reference Standards to Support Quality of Synthetic Peptide Therapeutics
- Related impurities in peptide medicines
- ICH Q2(R2) Validation of Analytical Procedures