quality questions
What Does 99% Purity Actually Mean?
It is one peak's share of a chromatogram — not a statement about what is in the vial. The distinction sounds pedantic and turns out to matter more than almost anything else printed on a certificate.
It is the share of one peak's area in a chromatogram, expressed as a percentage of all the peak area the detector recorded. That is the whole definition. It is a statement about a graph produced by a particular instrument running a particular method on a particular day, and only indirectly a statement about the vial.
Most of the misunderstanding around peptide purity comes from reading the figure as though it meant "99% of what is in this container is the peptide, and 1% is something else". It does not mean that, and in a lyophilised vial it is usually some distance from being true. Two different quantities are involved, they are routinely reported as one number, and the gap between them is not small.
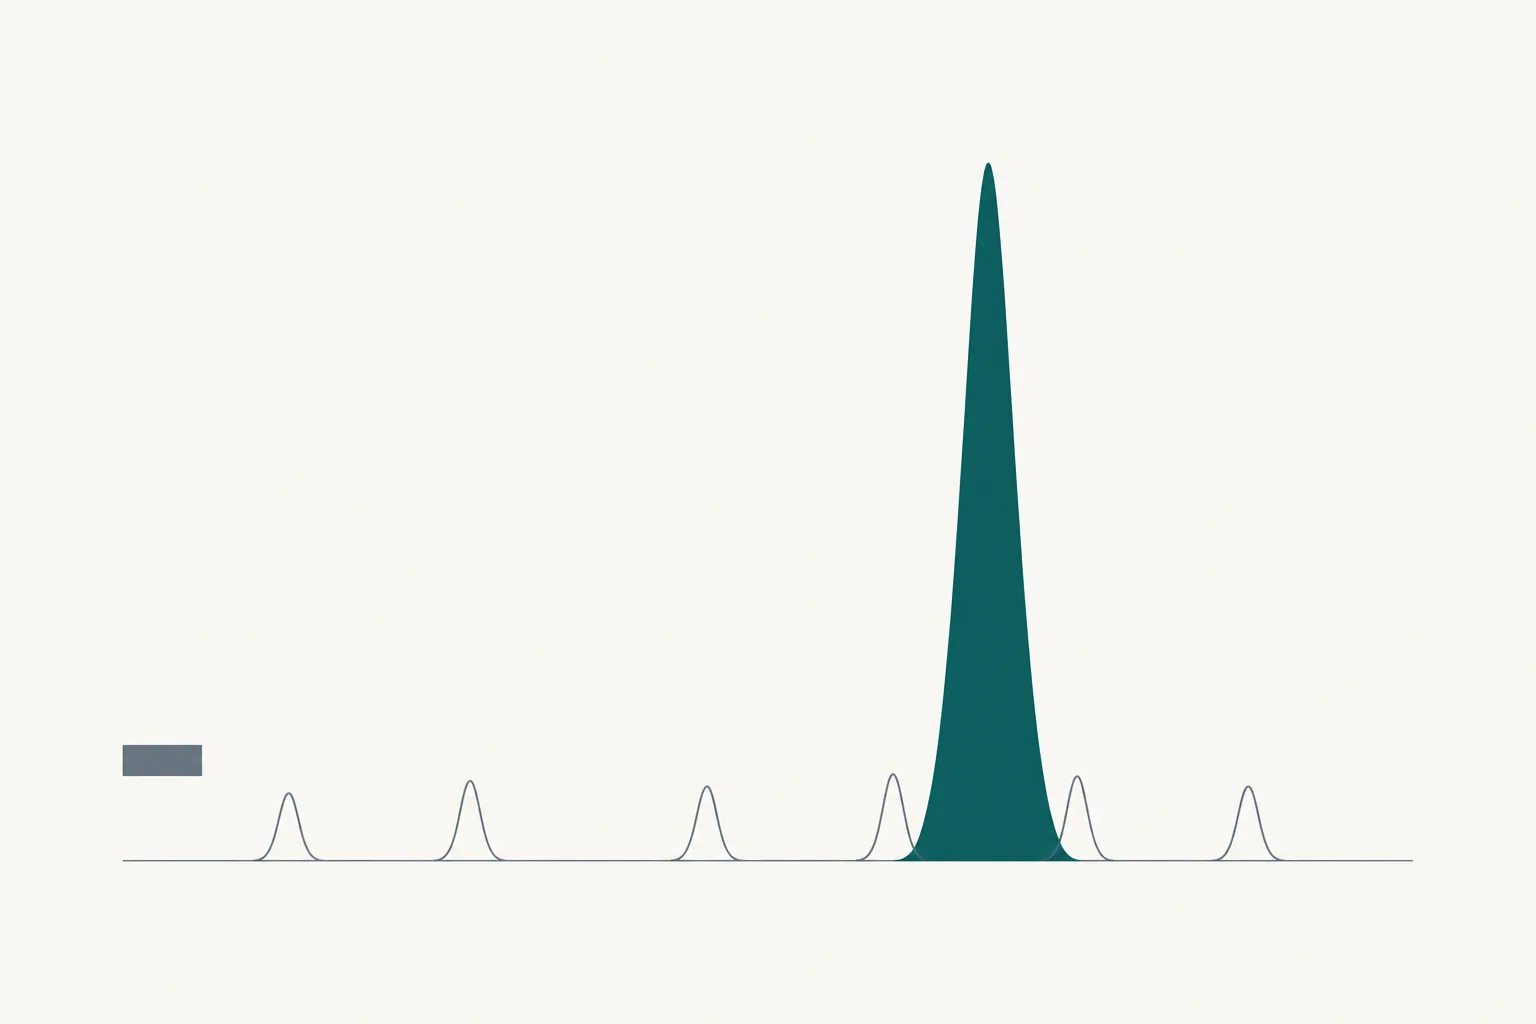
What is the 99% actually measuring?
A ratio of areas on a chromatogram, almost always from reversed-phase high-performance liquid chromatography with ultraviolet detection. The sample is dissolved, pushed through a column that separates components by how strongly they stick to it, and a detector records how much light is absorbed as each component emerges. Each component that comes off separately produces a peak. Purity is the main peak's area divided by the total.
That construction has three consequences that follow directly and are easy to miss. The first is that the figure is relative, not absolute: it says how the detected material was divided up, not how much material there was. The second is that anything the detector cannot see does not enter the calculation. Peptide detection is usually done near 214 nanometres, where the peptide bond itself absorbs, so most peptide-related species appear — but inorganic salts, many small organic residues and solvent are effectively transparent and simply do not register.
The third consequence is that the number depends on the method. A shallower gradient separates species that a steep one merges into a single peak. A different column chemistry changes which components resolve. A different wavelength changes their apparent relative sizes. Run the same sample two ways and two honest, correctly performed analyses can return different purity figures. This is why the formal guidance on specifications treats the analytical procedure as part of the acceptance criterion rather than an implementation detail: a limit means nothing without the method that produced it 3.
So a bare percentage on a document is an incomplete claim. The interpretable version names the technique, the column, the gradient and the detection wavelength, and ideally shows the chromatogram, because the shape of the trace carries information the summary number destroys — a clean baseline with one sharp peak and a lumpy baseline with a broad one can produce the same arithmetic.
What is the other 1%?
Almost always other peptides — close chemical relatives of the target, generated by the synthesis itself. It is rarely filler, and thinking of it as adulteration misses what is actually going on.
Synthetic peptides are built one amino acid at a time on a solid support, the method established in the early 1960s and still standard 1. Each coupling step is very efficient and not perfectly efficient. A chain that misses a coupling and then continues growing becomes a deletion sequence — the right peptide minus one residue in the middle. A chain that stops early becomes a truncated sequence. Protecting groups that do not fully come off leave modified species behind. All of these are close in size, charge and hydrophobicity to the target, which is exactly why they are difficult to separate and why they end up inside the small remaining fraction rather than being removed entirely.
Chemistry after synthesis adds more. Methionine, cysteine and tryptophan residues oxidise. Asparagine residues deamidate, producing a species differing by about one mass unit. Cysteine-containing peptides can dimerise through disulfide bonds, or fold into the wrong disulfide arrangement where more than one pairing is possible. Reviews of impurities in peptide products catalogue exactly this family — deletions, truncations, oxidation, deamidation, incomplete deprotection and aggregates — as the routine population of related substances in material made this way 2.
Two practical points follow. The impurity profile is a property of the production run rather than of the compound, so different batches of the same sequence carry different remainders. And the identity of that fraction can matter more than its size, since a deletion sequence and an oxidised variant are not equivalent problems even at identical percentages. A figure alone cannot distinguish them; a chromatogram and mass spectrometric characterisation can.
Why isn't purity the same as how much peptide is in the vial?
Because purity describes the composition of the peptide fraction and net content describes the mass of the vial. A lyophilised vial contains the peptide, whatever counterion it was isolated as, residual water left after drying, and any bulking agent that was included in the formulation. Purity chemistry looks at only one of those four.
The counterion is the part people are least prepared for. Purification is typically carried out under acidic conditions, and peptides with basic residues emerge as salts of the acid used — commonly trifluoroacetate, which binds tightly and is not trivial to remove or exchange 4. That salt has mass. For a peptide with several basic residues it can account for a noticeable share of the powder, and it contributes nothing to a chromatographic purity figure because the counterion does not produce a peak in the peptide detection window.
Residual water does the same thing more quietly. Freeze-drying removes most of the water and never all of it, and the remainder sits in the solid contributing mass. Add a bulking agent, which some formulations include to give the dried material physical structure, and the fraction of the vial that is peptide falls further still — all while the purity figure remains exactly where it was.
The number that answers "how much peptide is here" is net peptide content, determined by amino acid analysis, quantitative nuclear magnetic resonance or nitrogen determination. It is reported separately when it is reported at all. Where a quantity matters to the work, that is the line to look for, and its absence is not evidence of anything except that the question was not asked.
Why does almost every supplier quote the same figure?
Because it is the standard grade the contract manufacturers sell, and most sellers are not manufacturers. This is checkable and unremarkable, and it is worth stating plainly rather than treating as a discovery.
Research peptides are made by a comparatively small number of synthesis houses, largely working to the same catalogue tiers: crude, roughly 95%, roughly 98%, and 99% or better. Those tiers correspond to real differences in how much purification the material received. A seller sourcing from such a manufacturer inherits the manufacturer's specification along with the material, so the same figure reappearing across the market reflects a shared supply chain rather than coordination.
There is also a definitional reason the figure clusters. A specification is a limit a batch must meet, not a score it achieved 3. "Not less than 99%" is satisfied by 99.0 and by 99.8 alike, and both are reported as meeting the specification. Uniform quoted purity is therefore partly an artefact of how thresholds work, and the underlying batches are more varied than the labels suggest.
What actually varies between one quoted figure and another, then, is not usually the number. It is whether the number came from a measurement on the batch in front of you or was carried across from a catalogue description, whether the method is stated, and whether a chromatogram exists that anyone could look at. Those distinctions are visible on the paperwork. The percentage is not.
What does the number not cover at all?
Identity, quantity, water, salt, endotoxin and sterility — every one of which is a separate test. The most consequential omission is the first: purity is silent on whether the main peak is the molecule you wanted. A sample of entirely the wrong peptide, well made and well purified, is 99% pure. Purity measures homogeneity, not correctness, and the two are answered by different instruments.
| Property | Covered by a purity figure? | Determined by |
|---|---|---|
| Sequence identity | No | Mass spectrometry, sequencing |
| Share of peptide-related impurities | Yes, within the method's detection window | Reversed-phase chromatography, area percent |
| Net peptide content by mass | No | Amino acid analysis, quantitative NMR |
| Residual water | No | Karl Fischer titration |
| Counterion and salt load | No | Ion chromatography |
| Bacterial endotoxin | No | Endotoxin assay |
| Sterility | No | Sterility testing |
None of this makes purity figures worthless. A method-defined, batch-specific purity result with a chromatogram behind it is real analytical evidence about a real property, and material at 99% by a well-chosen method is genuinely different from material at 95%. The figure earns its place. It simply answers one question out of several, and it is regularly asked to answer all of them.
The practical translation is short. Read 99% as "the main peak was about 99% of the detected peak area, under whichever method was used". Then ask separately what the molecule is, how much of it is present, and what else came in the vial — because none of those three has been addressed yet.
References
- Solid Phase Peptide Synthesis. I. The Synthesis of a Tetrapeptide
- Related impurities in peptide medicines
- ICH Q6A Specifications: Test Procedures and Acceptance Criteria for New Drug Substances and New Drug Products: Chemical Substances
- Elimination and exchange of trifluoroacetate counter-ion from cationic peptides: a critical evaluation of different approaches